


Sakai Tutorials
Site StatsSite stats allows professors to display activity reports and statisitics. Statistics can be accessed from the initial tool page - which presents a quick overview of site usage statisitics - or from reports defined on the Reports page. A few Key Concepts to consider: Visit: The act of entering a site. Activity: Events generated by tool actions (e.g., new message, resource opened, etc.). The list of tools/events that count as activity can be configured on the Preferences page. Resource: Any file/folder item related activity (new, open, edit or delete). This tutorials page contains an example of using reports to keep track of student activity. The steps in this example are similar to what you are required to do to create a report - certain changes throughout the process need to be made that coincide with what report you are setting up.
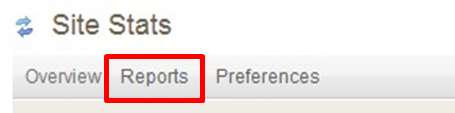
Creating ReportsIn this example, we are checking whether or not the students in the class have submitted their assignment. This example will also explain how to setup reports in Site Stats. 1. Under Site Stats, click Reports.
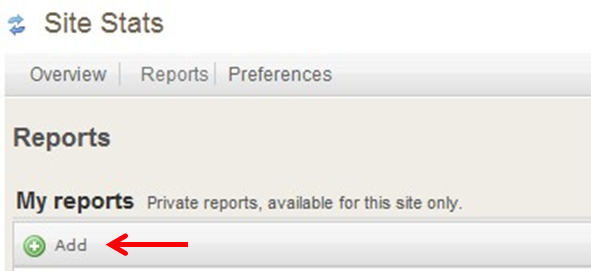
2. Under My Reports a list of saved reports will be displayed (to learn more about saving reports for later use click here).
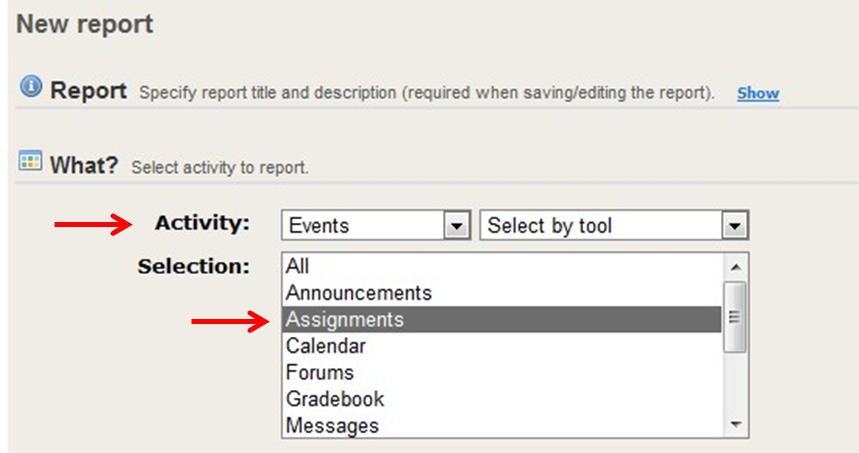
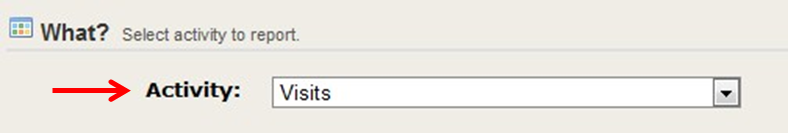
4. Set the Activity to "Events" and "Select by tool," which will allow us to select Assignments and see all events (such as submissions) that have occurred within that tool.
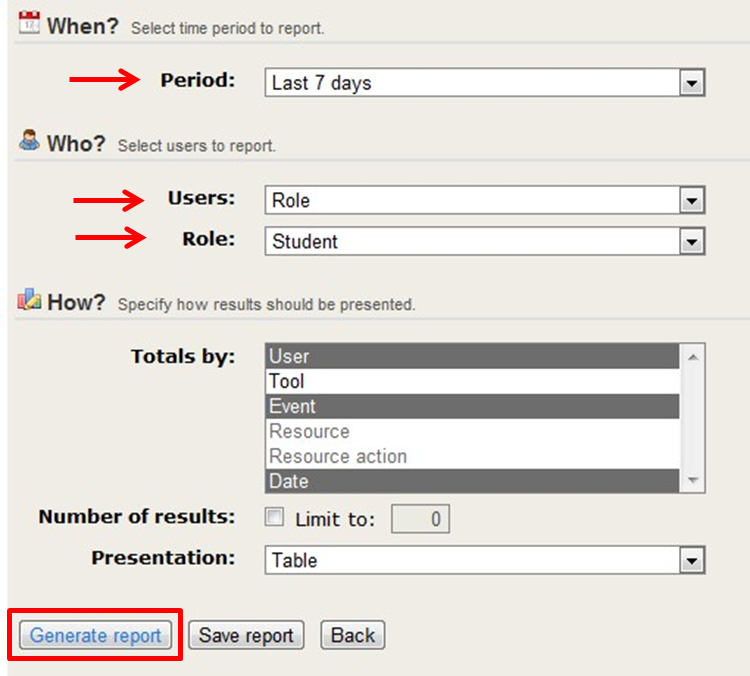
5. Set the time period to Last 7 days.
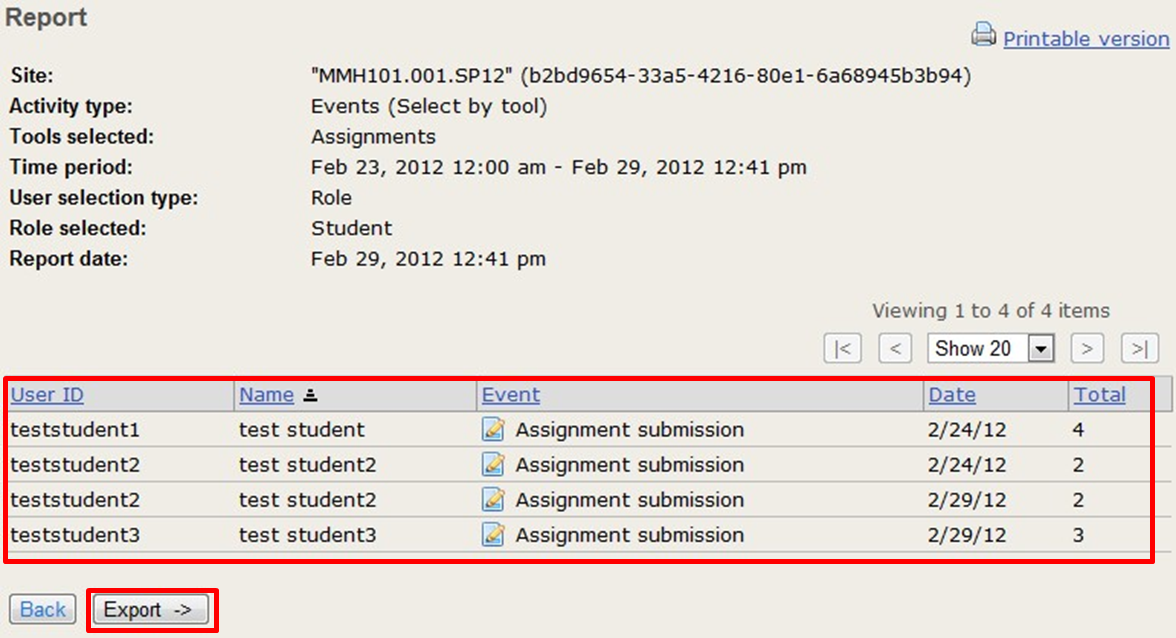
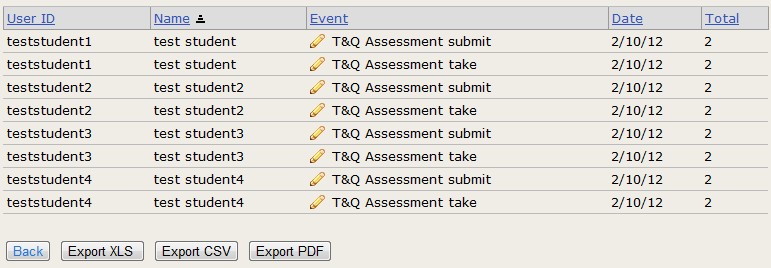
Exporting ResultsThe results of the report. Here we can see when the assignments were submitted - and through this one can infer how the students went about completing the assignments. We see that teststudent1 submitted all the assignments in one day, while teststudent2 submitted two assignments on two separate days. We also see that teststudent3 only submitted three of the four assignments. Note that we selected in the Last 7 days for the time period. This means that this data is time sensitive and will adjust based on the current date.
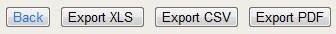
1. Click on Export.
2. When you select Export these options will display.
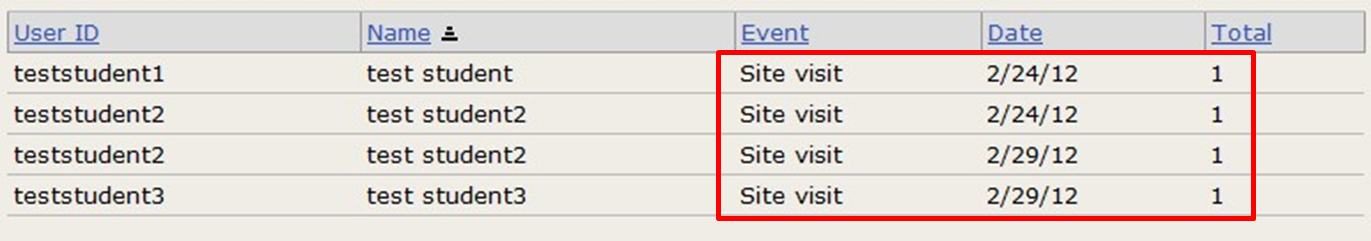
To create a report displaying visits, follow the steps above except for one difference. Change Activity to "Visits," and continue to generate the report.
The student's visits are recorded when they access a course site during a single logged in Sakai session. Site Stats will only record one visit per logged in session by the student. So, for example, if a student logs in and visits every one of their course sites twice within that session, the visit tally will only increase by one for each of the student's course sites. However, if these same actions occurred on two separate logins by the student, the visit tally would increase by two.
Save ReportsSaving reports can be very useful. This functionality makes it easier and much quicker to access your reports in Site Stats. Saving reports allows for the stats you need to be only a click or two away.
1. Create a new Report in Site Stats.
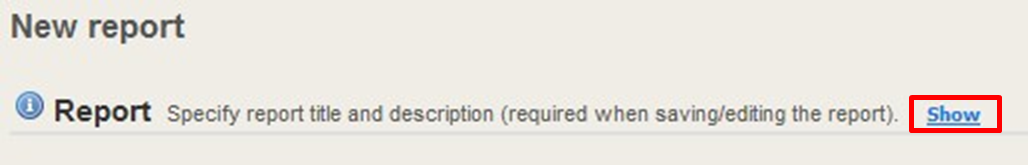
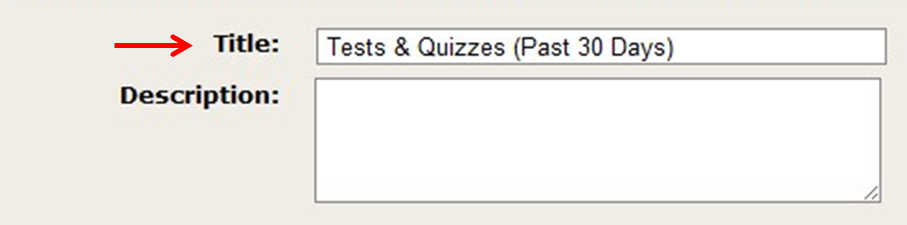
3 Give the report a title and an optional description.
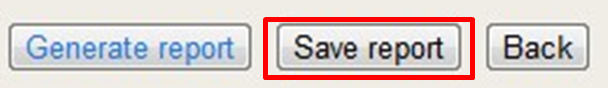
4 Continue customizing this specific report.
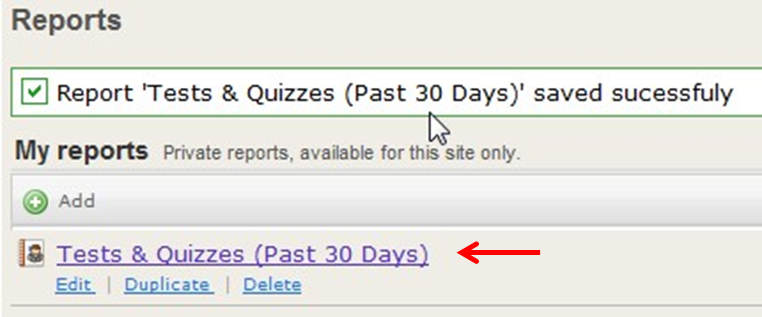
You will see that your report has been saved. To access the report, click on the name of the report. A list of saved reports will be present on the Reports page in Site Stats. You can return to this page to edt, duplicate, or delete reports as well.
After clicking on the title of the report, the report will run and the results will be displayed. Note that a report with a day range (such as 7 or 30 days) will start from the current date each time the report is run. Use the export options to keep track of specific intervals if needed.
|
| Sakai home | policies | maintenance | Sakai tools |
© 2015 The University of North Carolina at Chapel Hill Sakai Tutorials by University of North Carolina at Chapel Hill is licensed under a Creative Commons Attribution-Non Commercial-Share Alike 3.0 Unported License. |